CSR strategy
CSR strategy objectives
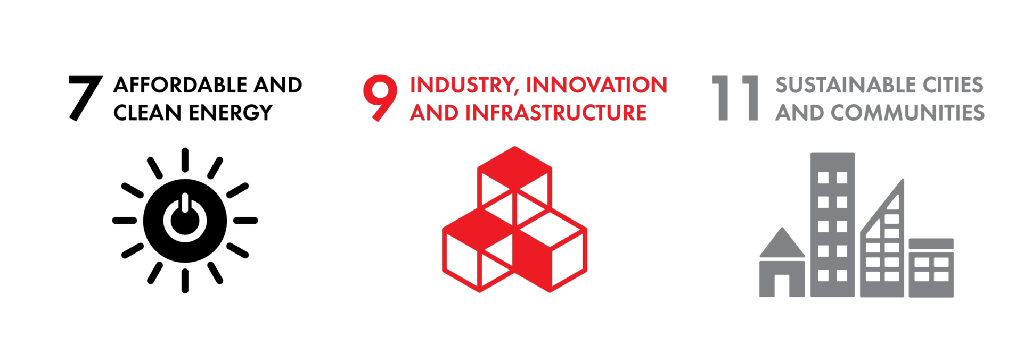
The value we create for our stakeholders can be directly traced back to our business model. Our financial results ensure that we can continue to create value for society in the long term by improving the accessibility and quality of life in urban areas. We are also contributing to realising UN Sustainable Development Goals, and to SDGs 7, 9 and 11 in particular.
Q-Park Liveability Model
The Q-Park Liveability Model (QLM) is the overarching strategic model for Q-Park's CSR activities, through which we can steer our business to create value for our stakeholders and society. We seek to improve the liveability and sustainability of cities through our policies and activities.
We first developed the QLM in 2015 and have structured our CSR reporting around this. In 2020 we have updated our Liveability Model to incorporate new and changed priorities as identified in our 2020 materiality analysis.
We have developed a visual to communicate our CSR focus areas in a clear and simple manner. It has three layers:
Values: The inner layer is the strategic layer with the four core values. All values are equal and provide a balanced and integrated 360° view on our business impacts.
Value creation
Value capturing
Value sharing
Value retention
Critical Success Factors: The second layer is the tactical layer and shows the critical success factors (CSF) in which Q-Park must excel.
Key Performance Indicators: The third layer is the operational layer for which we have defined key performance indicators (KPI). Where this layer is missing, there will be qualitative reporting on the CSF.
Reporting processes and data quality
We continually endeavour to simplify the reporting process and make this more efficient. Our KPIs are well-defined and our back-office systems allow us to extract more and more relevant information. This reduces the amount of time needed by the country organisations and increases the data quality.
In the following sections we report on our performance and explain how we create value per CSF and KPI in each quadrant. We report our results over 2020 and where we have the data available, we show comparable results for 2019 and 2018.
Figure 13 Contributing to realising UN SDGs - 7, 9 and 11 in particular

